So, you’re selling on Amazon—and you already know the hustle.
The process of keeping track of sales, controlling inventory, and calculating profits frequently seems more complicated than it needs to be. Perhaps you have relied on Amazon’s built-in reports in the hopes that they will suffice. However, they aren’t designed for expansion, let’s face it.
Does that sound familiar?
This is where ReportZapp, an all-in-one Amazon seller analytics dashboard, comes in. It’s made to make your business easier, give you full control over your Amazon performance, and unlock powerful insights. This comprehensive guide demonstrates how ReportZapp can help you automate your reporting and transform raw data into actionable strategy, regardless of how quickly you’re scaling or how new you are.
The basic information is provided by Amazon’s default reports: what you sold, when you sold it, and how much. However, what about your real earnings, inventory patterns, or the products that are consuming your advertising budget?
The fact is that standard Amazon analytics for sellers are insufficient. They lack important characteristics such as:
You need more than just surface-level metrics to compete in the Amazon marketplace today. ReportZapp provides the robust Amazon reporting software you require.
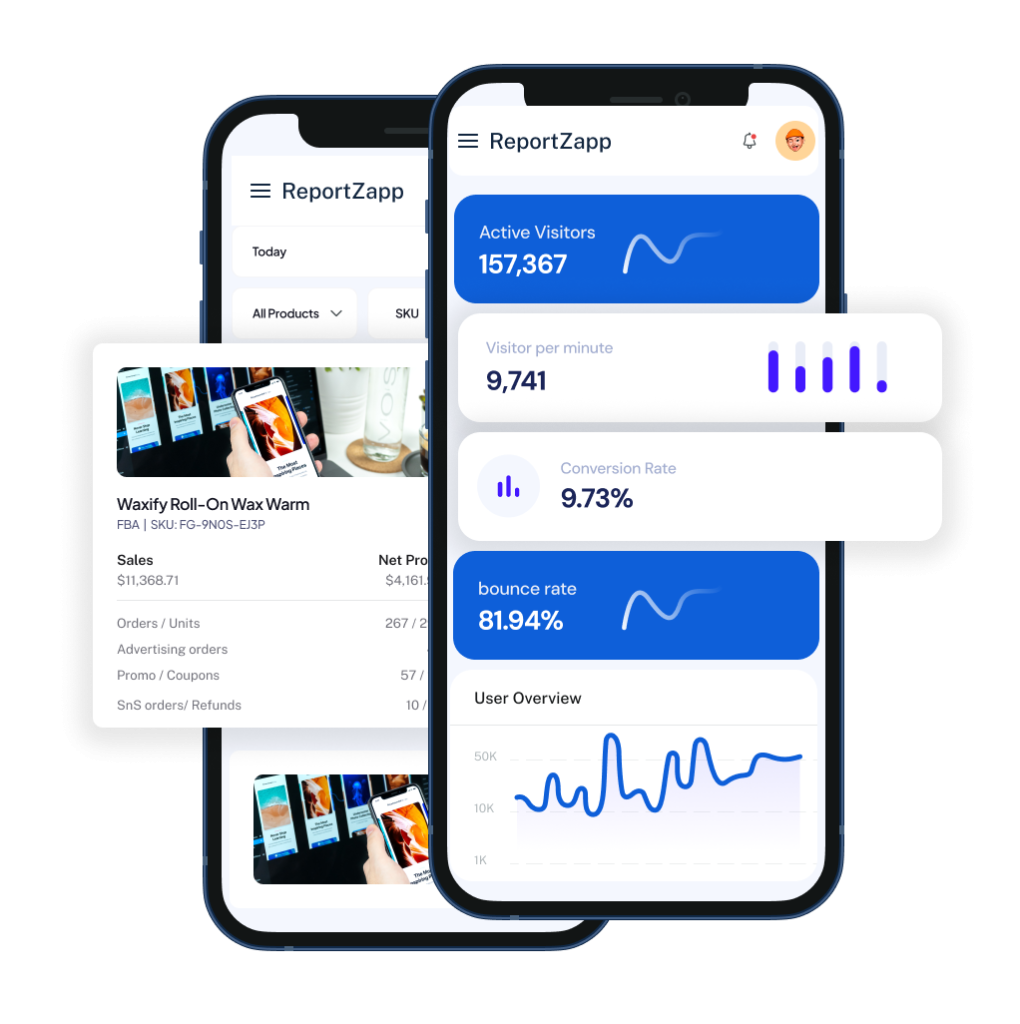
It just takes a few minutes to get started with ReportZapp.
From the beginning, you’ll have access to a single, user-friendly dashboard that contains everything from advanced inventory analytics to Amazon reimbursement reports.
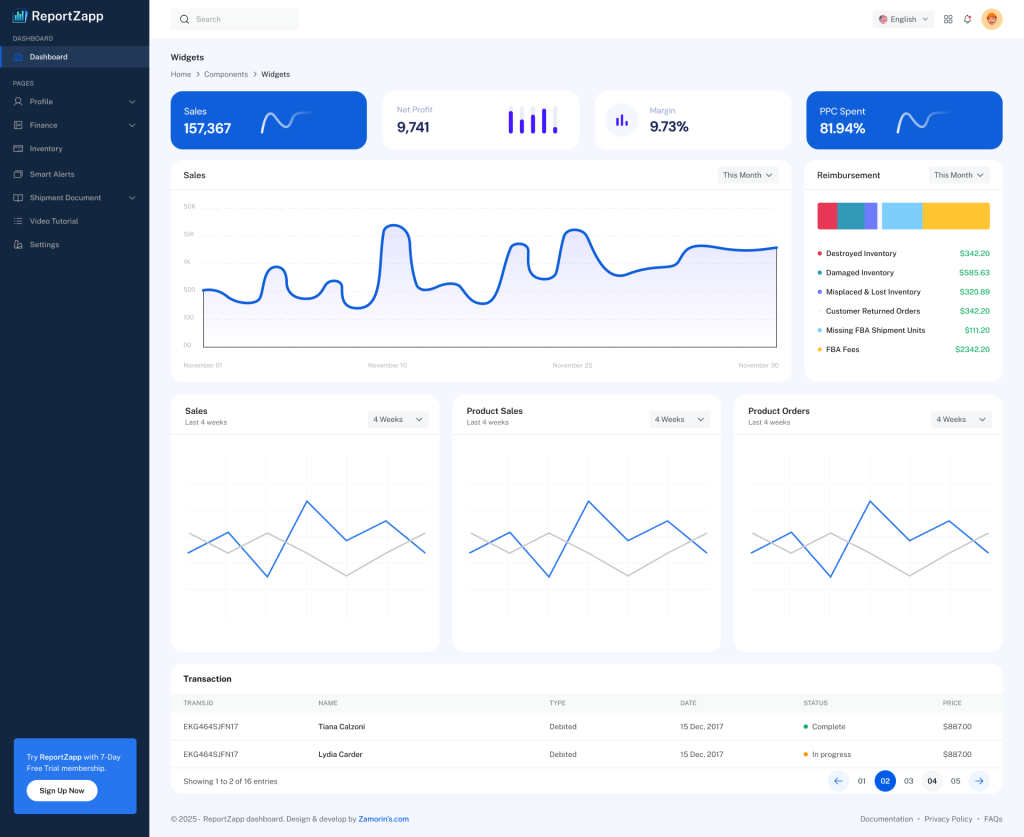
Your new Amazon seller analytics dashboard becomes the hub of your Amazon business once it’s connected. No more switching between tabs and spreadsheets. Here is everything you require, including:
The dashboard can be tailored according to the most important factors, such as campaign ROI, product performance, or profitability. ReportZapp gives your decisions clarity and confidence, regardless of how many SKUs you’re managing—10 or 10,000.
When you can forecast the future, why limit yourself to examining the past?
ReportZapp’s integrated Amazon sales forecasting uses historical data and market trends to assist you in:
And things improve. Complex trends are simple to identify with ReportZapp’s data visualization tools, such as interactive charts and heatmaps. You can view everything at a glance and make quick, well-informed decisions rather than sifting through spreadsheets.
Are you already utilizing Amazon QuickSight or AWS Business Analytics? With its smooth integration, ReportZapp adds specialized tools for Amazon business analytics to your tech stack.
Do you need to look beyond the dashboard? You can focus on the most important KPIs with the help of ReportZapp’s custom reporting features. You could:
ReportZapp is more than just another Amazon reporting tool because of its degree of flexibility. It is a comprehensive data intelligence tool designed for sellers who wish to grow strategically.
ReportZapp tells you what those numbers mean—and more importantly, what to do next—in contrast to traditional reports that merely show numbers.
For instance:
Every insight gives you the ability to make data-driven decisions that reduce costs, improve productivity, and raise income.
Let’s face it, running your Amazon store while wearing a blindfold can be like spinning plates. You don’t need more confusion; you need speed, strategy, and clarity.
✅ ReportZapp offers sellers real-time Amazon analytics
✅ Automated reporting that saves hours
✅ Forecasting tools that help avoid costly errors, and more.
✅ A platform designed for growth that expands with your company
Consider it more than just software; consider it your analytics co-pilot, allowing you to manage every aspect of your Amazon business.
While Amazon Seller Central reports offer minimal sales information, ReportZapp provides more in-depth information, such as real-time sales analytics, inventory management, sales forecasting, and custom reporting.
Yes! ReportZapp integrates smoothly with AWS analytics tools, such as Amazon QuickSight and AWS business intelligence, to offer advanced data visualization and business intelligence.
ReportZapp forecasts future sales based on historical data and trends in the market, enabling you to plan more effectively for your inventory and marketing.
Yes. ReportZapp includes comprehensive Amazon reimbursement reports so that you can monitor reimbursements and reclaim money due to you.
Yes, ReportZapp is beginner-friendly and helps new sellers navigate the complexities of Amazon seller analytics, even if you’ve never used advanced reporting tools before.
The Amazon Seller Analytics Dashboard is a tool that provides sellers with comprehensive insights into sales, profits, inventory, and business performance to help optimize their Amazon business.
ReportZapp offers advanced Amazon analytics features like SP-API integration, real-time sales dashboards, profit tracking, inventory analytics, and sales forecasting tailored specifically for Amazon sellers in the USA.
Yes, ReportZapp fully supports Amazon’s Selling Partner API (SP-API) to provide accurate, up-to-date data for your seller analytics dashboard.
ReportZapp provides inventory insights such as stock levels, turnover rates, and demand forecasting to help you manage your Amazon inventory efficiently.
Absolutely. ReportZapp includes detailed profit tracking features that help you monitor your margins, expenses, and overall profitability.
If you’re tired of basic reports and ready to take command of your data, it’s time to switch to ReportZapp.
👉 Join the waitlist, book a free demo, or start your free trial today.
Let ReportZapp turn your numbers into knowledge—and your knowledge into profits.
ReportZapp is best software platform manage your sales depends on your specific business needs budget & industry.