The margins are under strain. FBA fees are increasing. Competition is tough. PPC costs are reducing earnings. If you only rely on Amazon Seller Central reports, you’re not getting the complete picture. ReportZapp, an Amazon seller analytics tool, can help here.
Product gaps relate to the opportunities that are lacking from your catalog. Perhaps you’re running low on high-converting ASINs or overstocking goods that hardly sell. These silent killers reduce your profit margins.
Amazon inventory analytics tools let you identify these gaps before they cost you money. Knowing what’s missing can be as effective as knowing what’s selling.
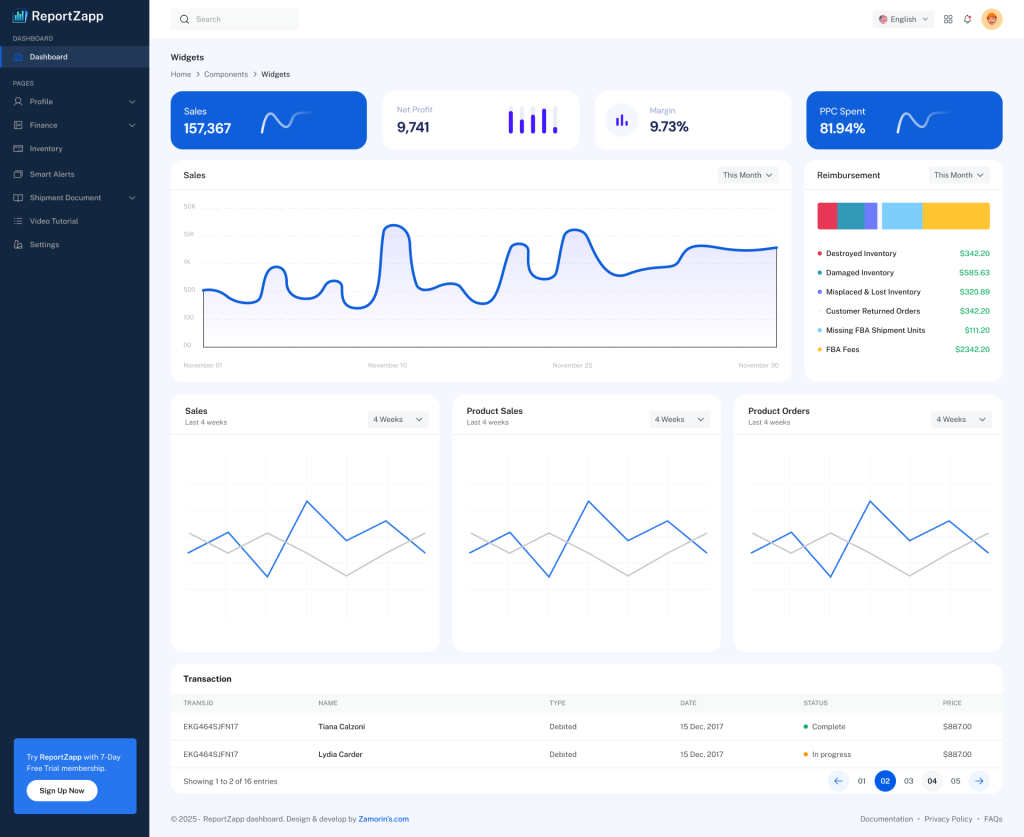
ReportZapp links straight to your Amazon SP-API, converting raw data into understandable, visual reports. The Amazon seller report tool with a free trial can reveal:
Want to see it in action? Here’s our feature walkthrough.
Start by linking ReportZapp with your Amazon SP-API integration. Setup is secure and takes minutes.
Use the Amazon sales dashboard to view your top-selling SKUs, inventory status, and product-level profitability in one glance.
View the "Gap Alert" feature that flags stockouts, pricing issues, and margin anomalies.
Make changes to pricing, PPC, or restocking strategy based on real-time Amazon analytics for sellers.
Use the built-in Amazon sales forecasting software to plan your next moves.
These insights are standard in ReportZapp’s Amazon analytics dashboard.
Your spreadsheets aren’t lying, but they’re certainly not revealing the entire truth. ReportZapp creates a 360-degree picture by combining Amazon seller central information, Amazon reimbursement reports, and Amazon brand analytics.
Imagine going from observing shadows on a wall to seeing in high definition.
You can’t mend something you don’t see. Amazon product analytics is no longer optional; it is your competitive advantage. ReportZapp does more than just crunch numbers; it also tells you where you should focus.
Use an Amazon analytics tool like ReportZapp to track stock levels, pricing inconsistencies, and profit margins across all SKUs.
A tool like ReportZapp breaks down product-level profitability, refunds, and fees in real time with visual dashboards.
Yes. With Amazon SP-API integration, ReportZapp automates your Amazon seller central sales reports and even sends daily insights to your inbox.
Use Amazon inventory analytics to spot dead stock and apply discounts or removal strategies.
Want to spot profit leaks before they spread?
Book your ReportZapp demo today.
ReportZapp is best software platform manage your sales depends on your specific business needs budget & industry.